1 31¢ piece
Instructions: Please stow your laptops and phones until the laptop portion of the activity.
Consider a 31¢ piece created by fastening a dime to a penny to a quarter.
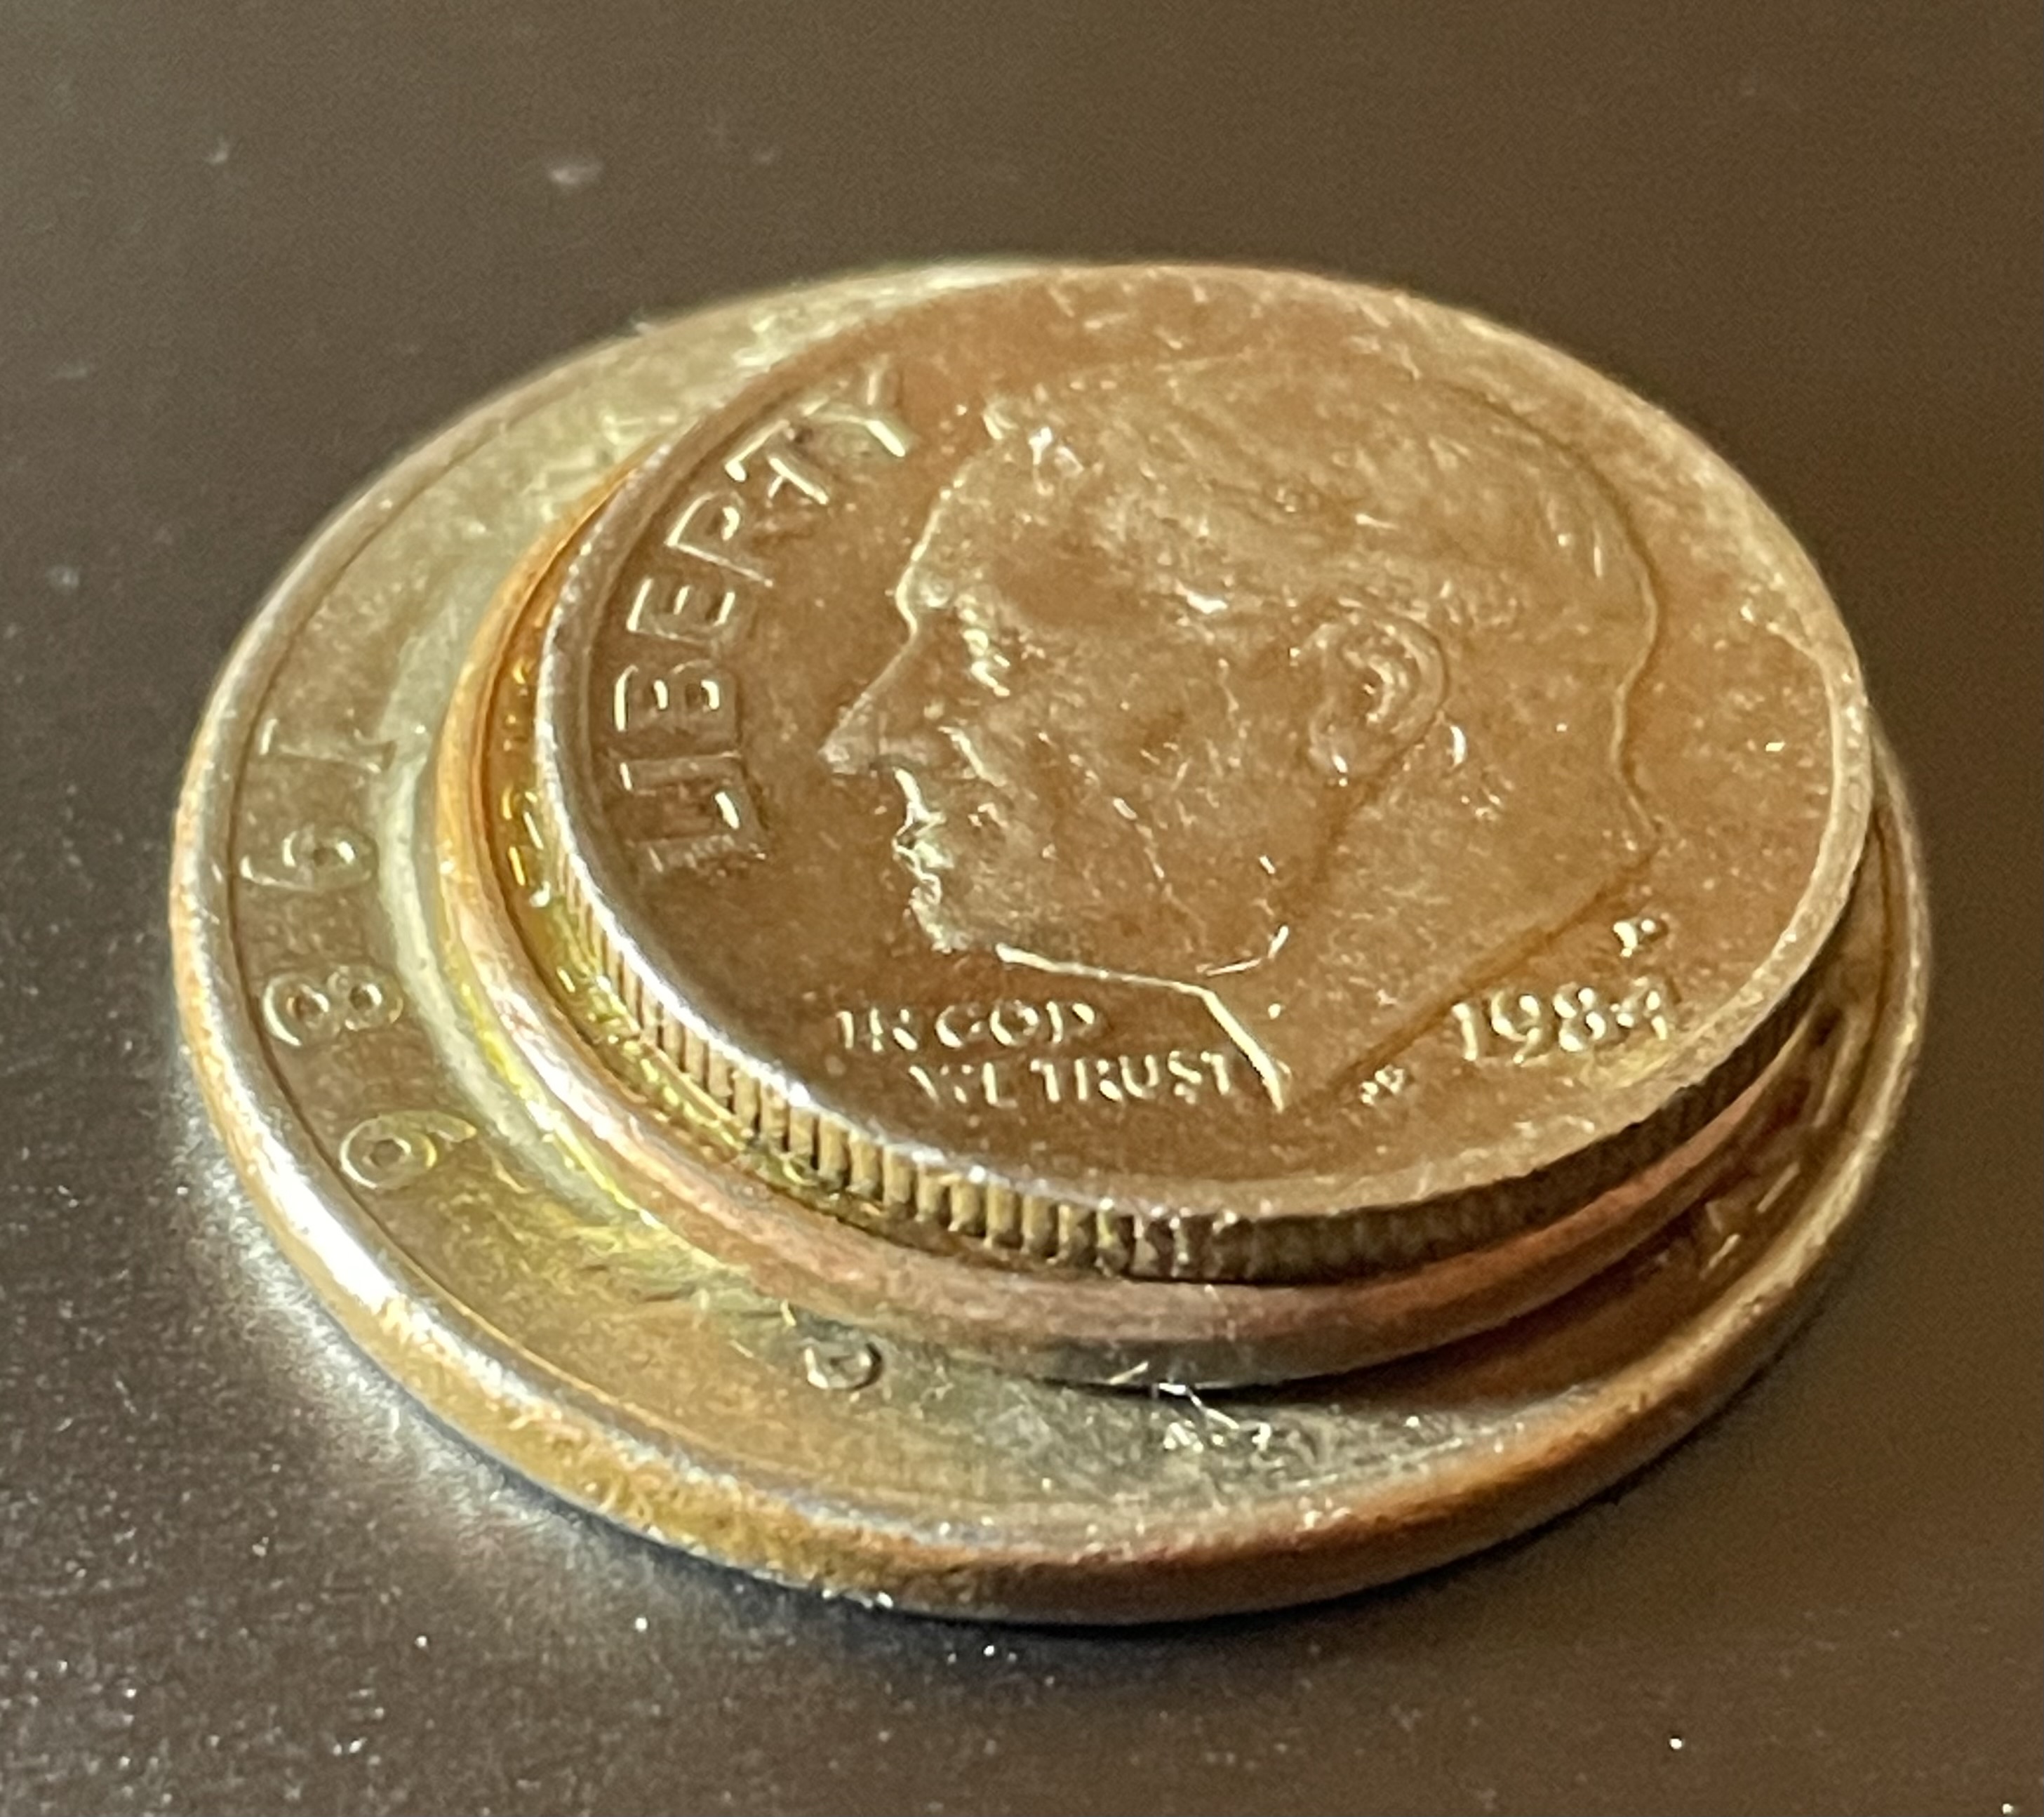
Looking at the 31¢ piece in the photo,
- Do you think the piece is equally likely to land on either side?
- Do you think the coin is more likely to land on one side (heads or tails) compared to the other?
- If you were to repeatedly flip the coin, what proportion of flips do you suppose would land heads?
- How certain are you about your answer to 3?
1.1 Exercise
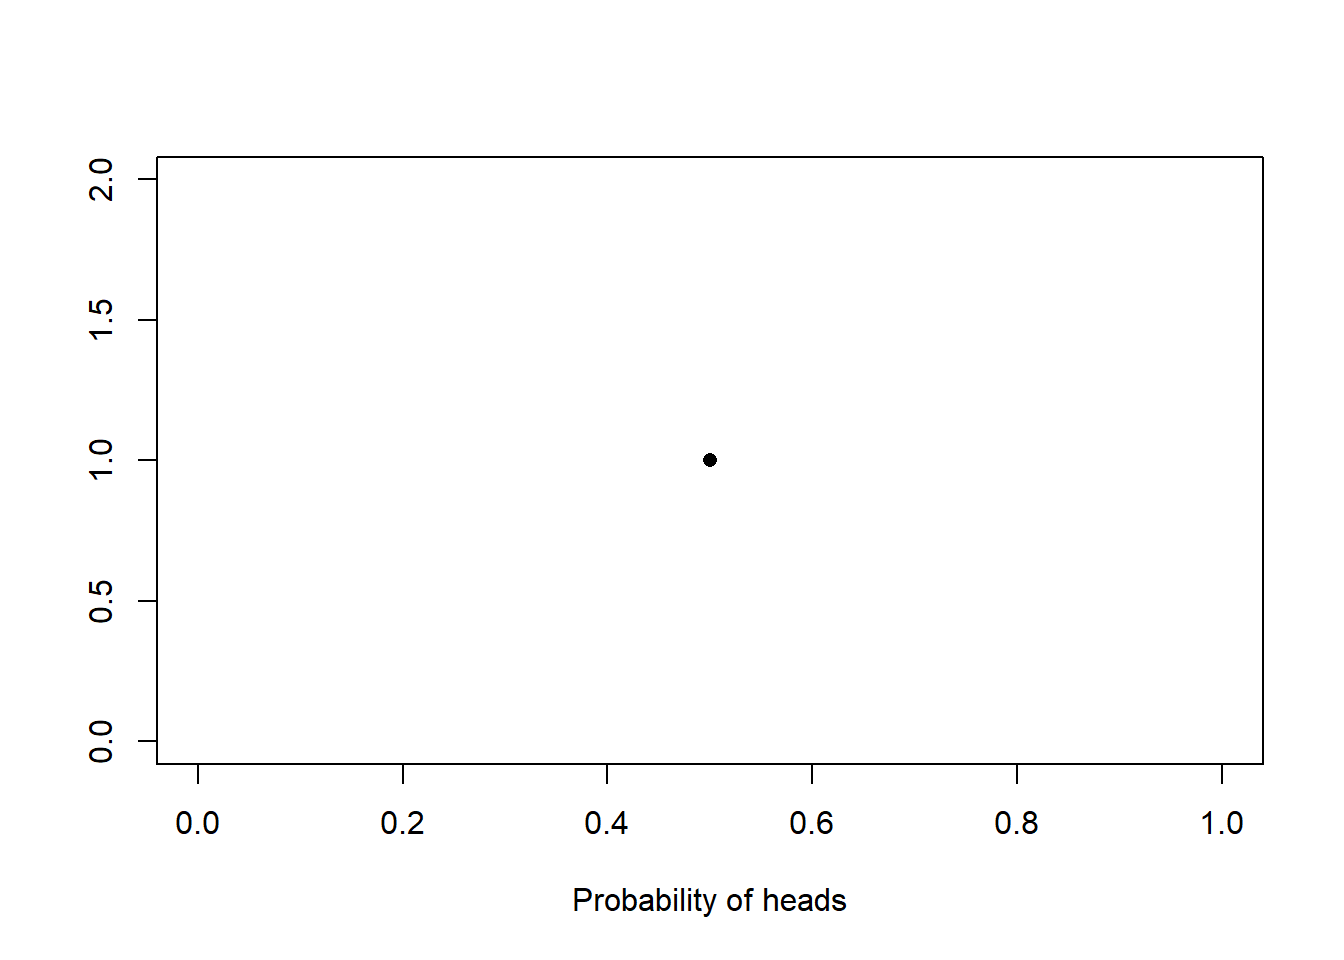
- Sketch out the figure below.
- Mark 0, 0.1, 0.2, …, 0.9, 1.0 on the x-axis.
- Start with 0.9. Which is more likely: that the true probability of a heads is 0.5 or 0.9? How much more/less likely is 0.9 to be the true probability relative to 0.5? If it is equally likely, mark a point at (0.9, 1). If 0.9 is twice as likely to be the true probability of heads (compared to 0.5), then mark a point at (0.9, 2). If 0.9 is half as likely to be the true probability, mark a point at (0.9, 0.5). If you think 0.9 is X times more/less likely to be the true probability of heads, mark a point at (0.9, X).
- Repeat step three for all values along the x-axis.
- Connect the dots.
1.2 Exercise
- Recreate the plot from the previous exercise, supposing that you are extremely certain that the true probability of heads with the 31¢ piece is 0.6.
- Recreate the plot from the previous exercise, supposing that you think the true probability is 0.4 but you are very uncertain about it.
1.3 Exercise
- Collect data by flipping the coin several times, recording the sequence of heads and tails as you flip the coin.
1.4 Exercise
This exercise is slated for the hands-on, laptop portion of the activity. Please wait until the instructor invites the class to use laptops to complete this example.
- Navigate here
- Use sliders \(\alpha\) and \(\beta\) to find curves which match the shapes you drew in the previous exercises. Make a note of the \(\alpha\) and \(\beta\) values that best match your figures.
- Enter your coin flip data in the array L.
- Click the circle in line 12 and use the slider in line 15 to see how the shape is updated. The change in shape represents the change in beliefs about the probability of heads as data is collected from the coin flips.