flowchart TB
subgraph "This slide deck"
A[Data types]
end
A --> B[Discrete]
A --> C[Continuous]
B --> D["<p style='text-align:left;'>Probability\n+ Long-run proportion\n+ AND a ∩ b \n+ OR a ∪ b\n+ IN x ∈ {a,b,c}\n+ Conditional a|b\n+ Marginal\n+ PMF\n+ CPF (CDF)</p>"]
D --> E["Examples of random variables"]
F["<p style='text-align:left;'>Balls from buckets\n+ Replacement (with or without)\n+ Order (Hand or sequence)</p>"]
E --> F
E --> G["<p style='text-align:left;'>Coin flips (weighted):\n+ Bernoulli (1 flip)\n+ Binomial (N flips)\n+ Neg Binomial (K successes)\n+ World Series (K successes or failures)</p>"]
E --> H["Events per period time\n+ Poisson"]
3 Data types
There are lots of ways to group and organize data. Here are just a few:
- Univariate vs multivariate. Some random variables are a single number, like cholesterol or heart rate. In other situations, the sequence of measurements might be of interest. Rather than a single cholesterol measurement, one might consider yearly measurements of cholesterol. Or, one might consider an outcome that is an array of outcomes, like an image. Each pixel represents an outcome, and the pixels are organized into a matrix. One step further, one might be interested in a sequence of images. In this case, the outcome would be and three-dimensional array. Single number outcomes which are considered in isolation are univariate outcomes. When the outcome of interest is more than a single number, it is called a multivariate outcome.
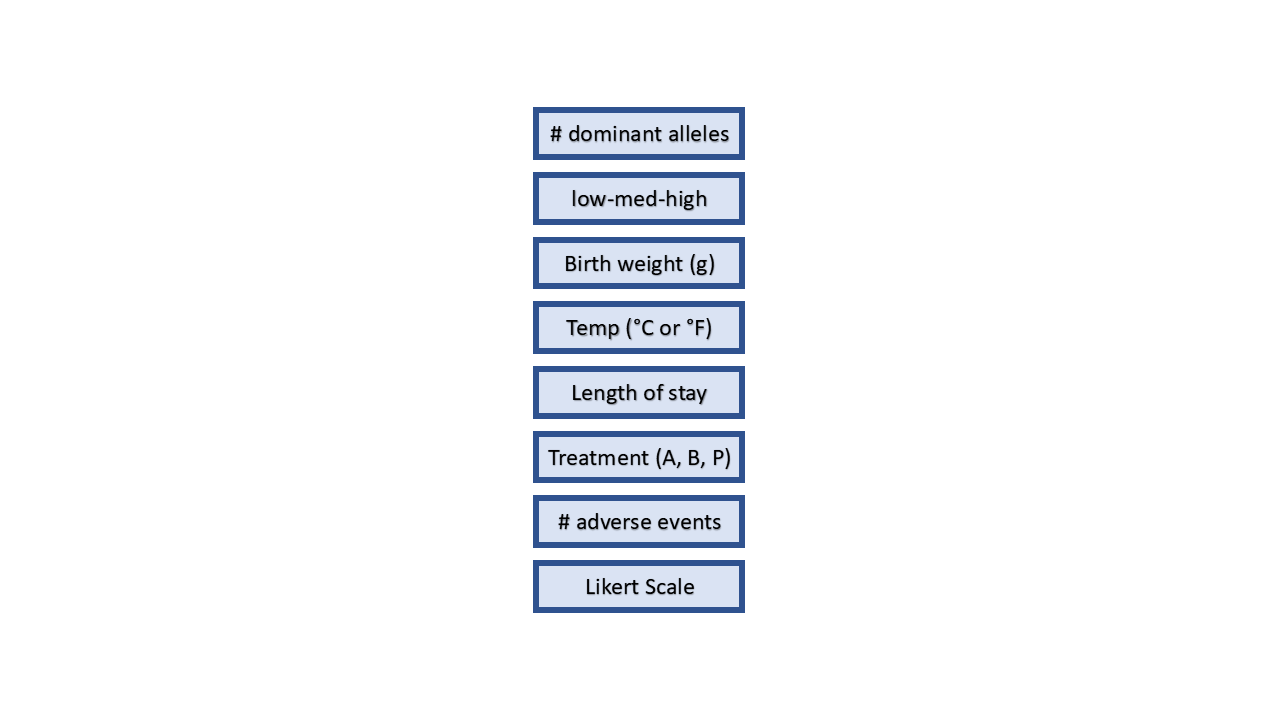
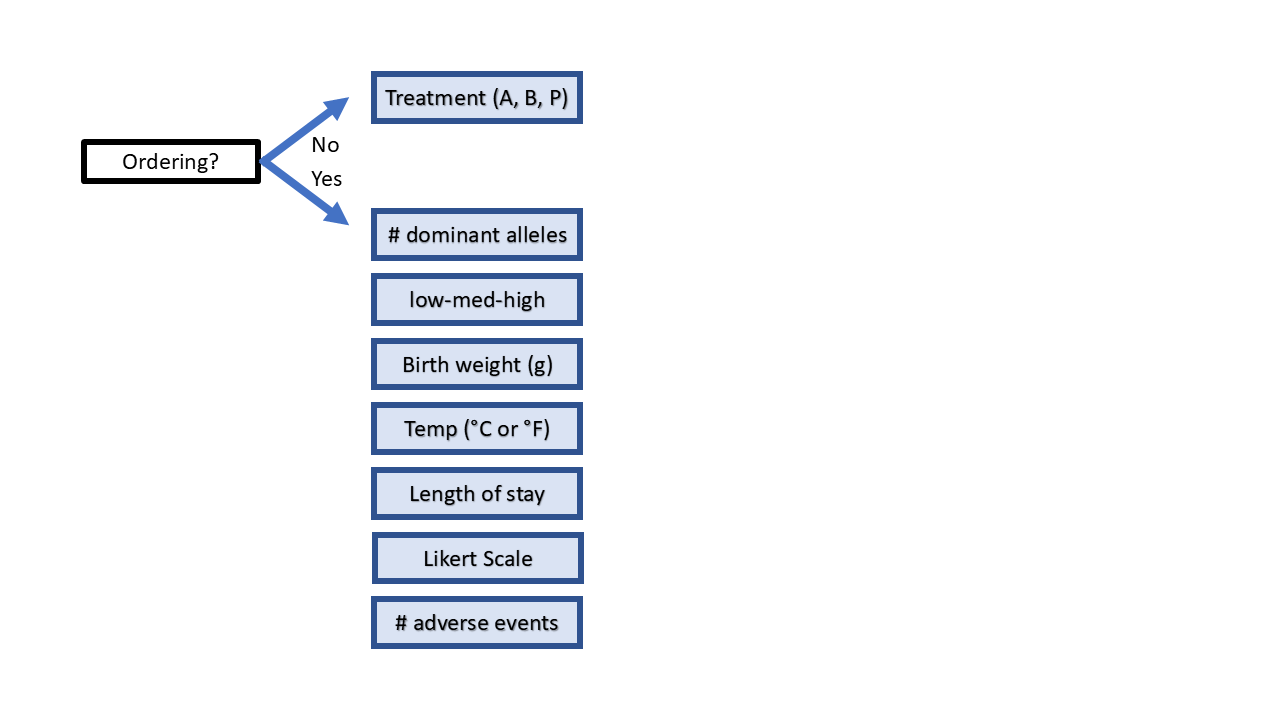
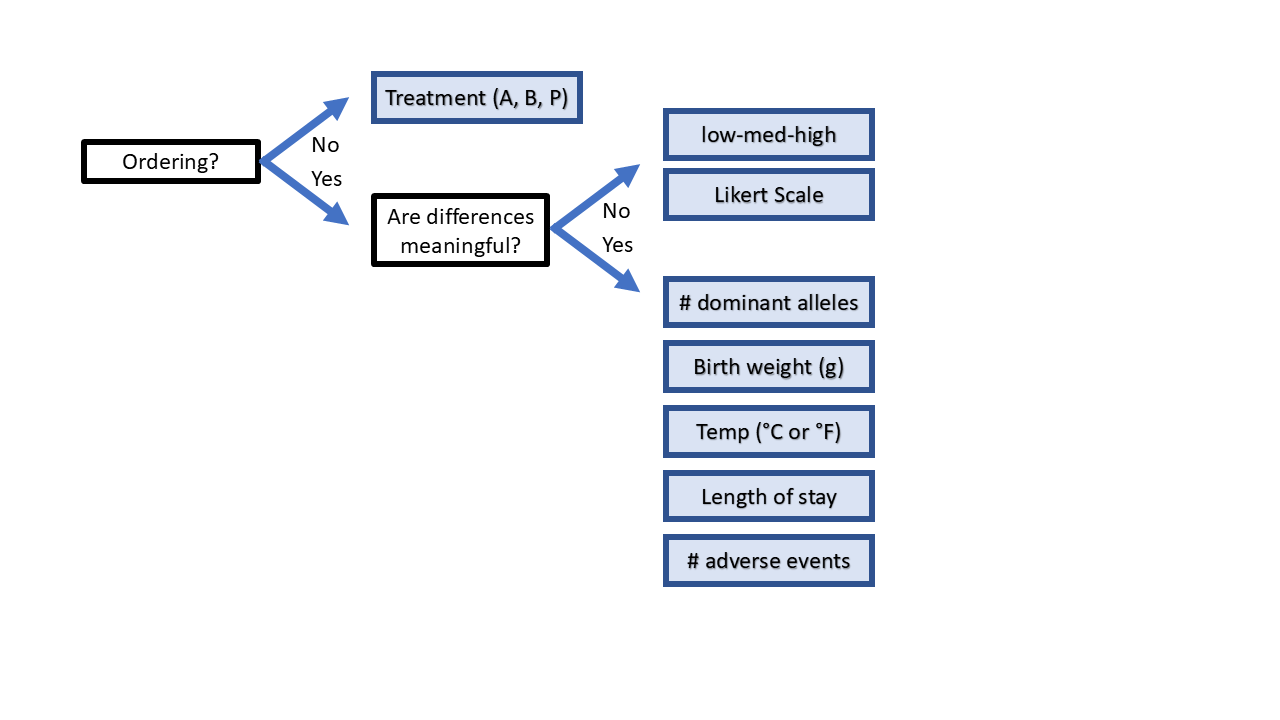
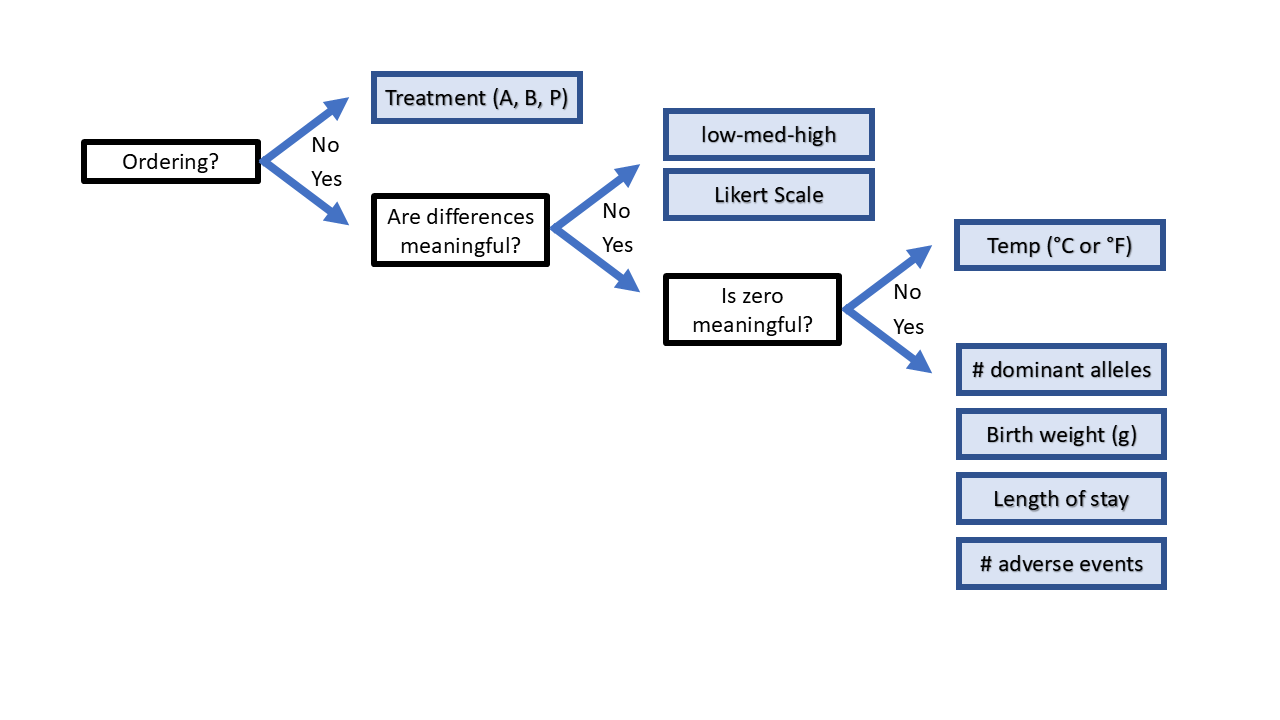
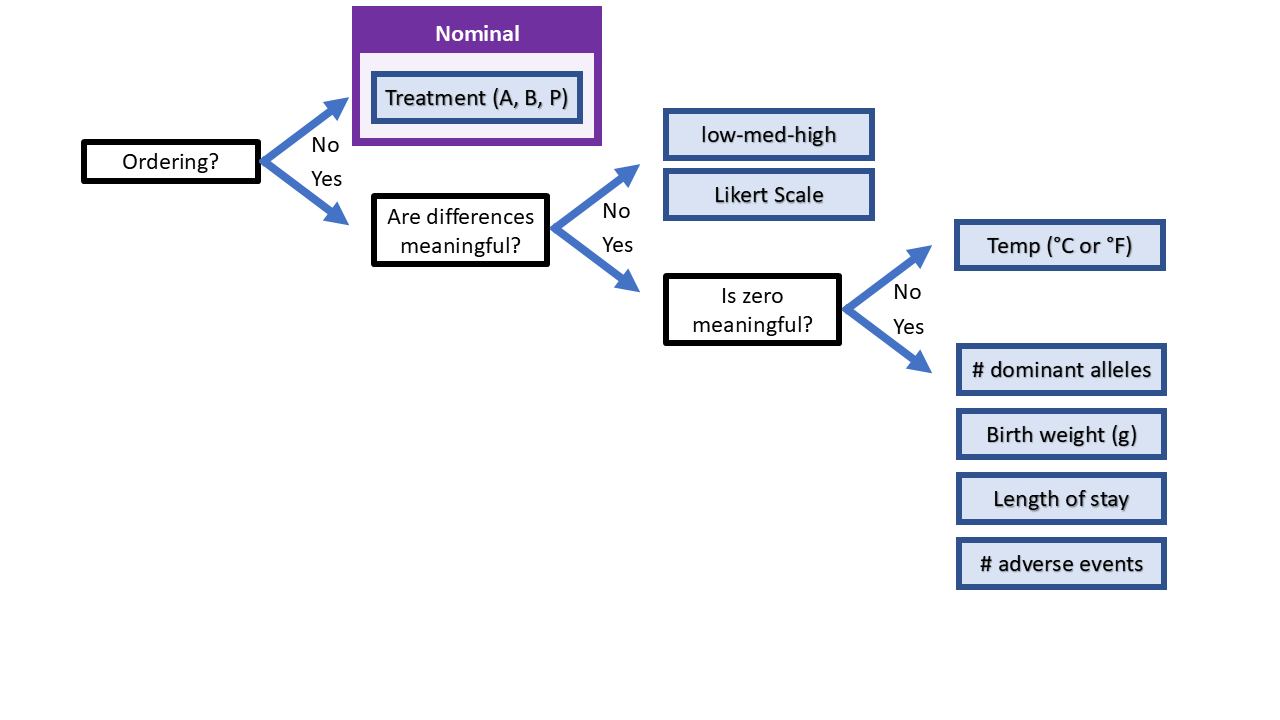
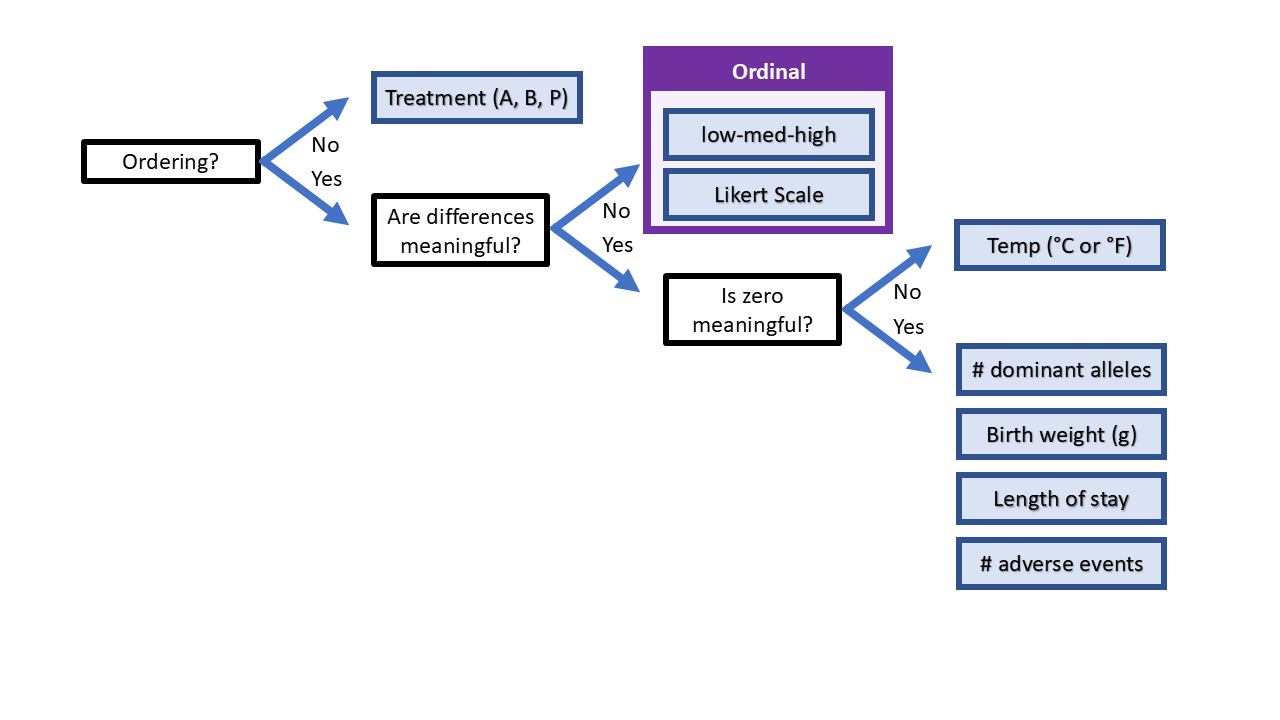
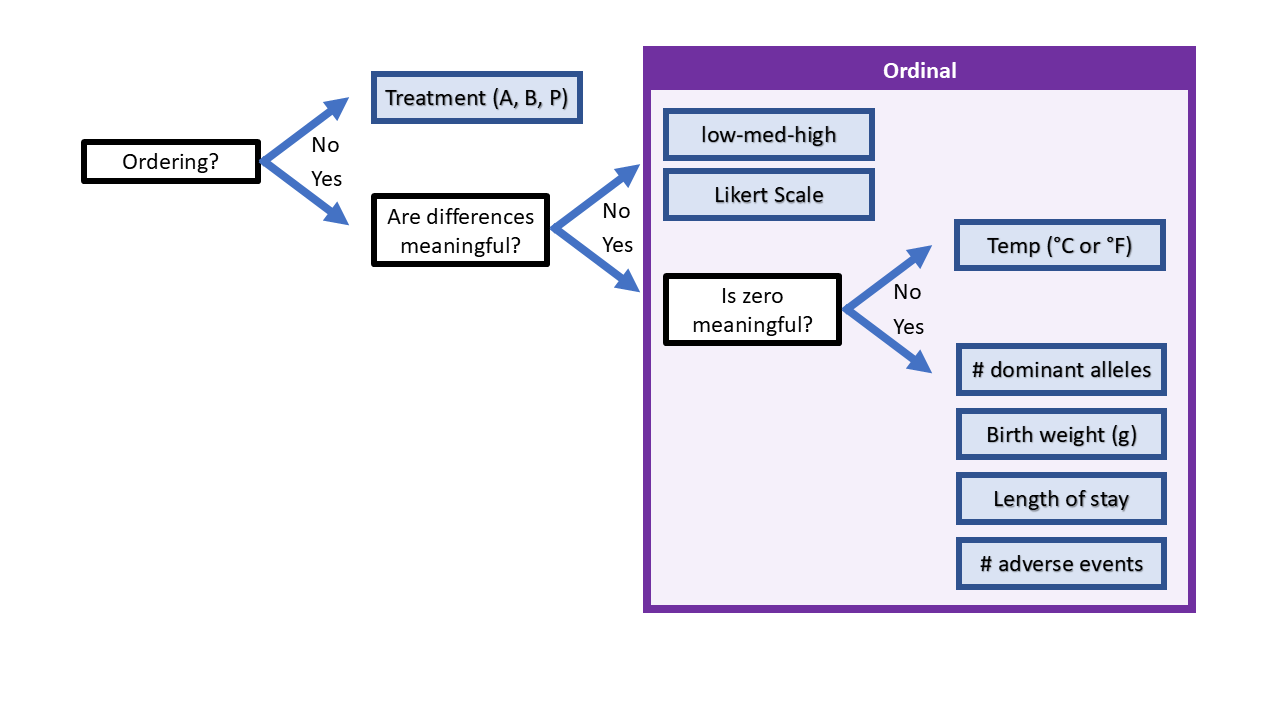
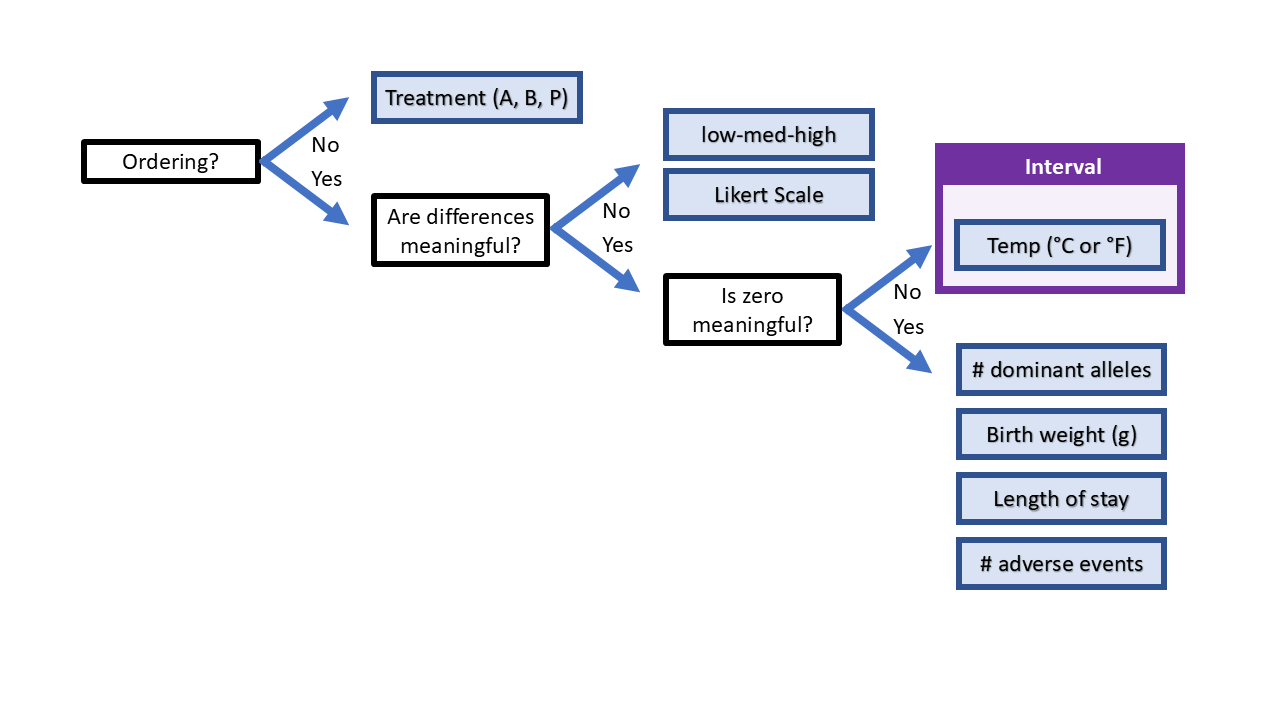
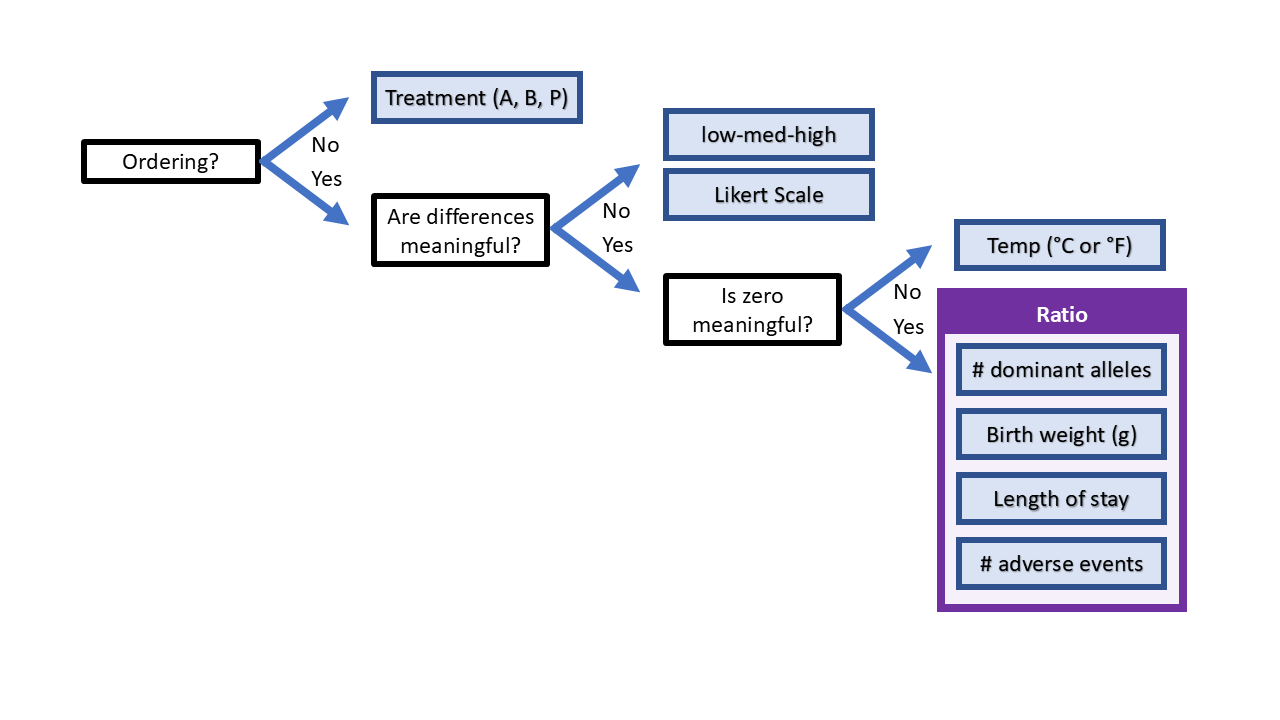
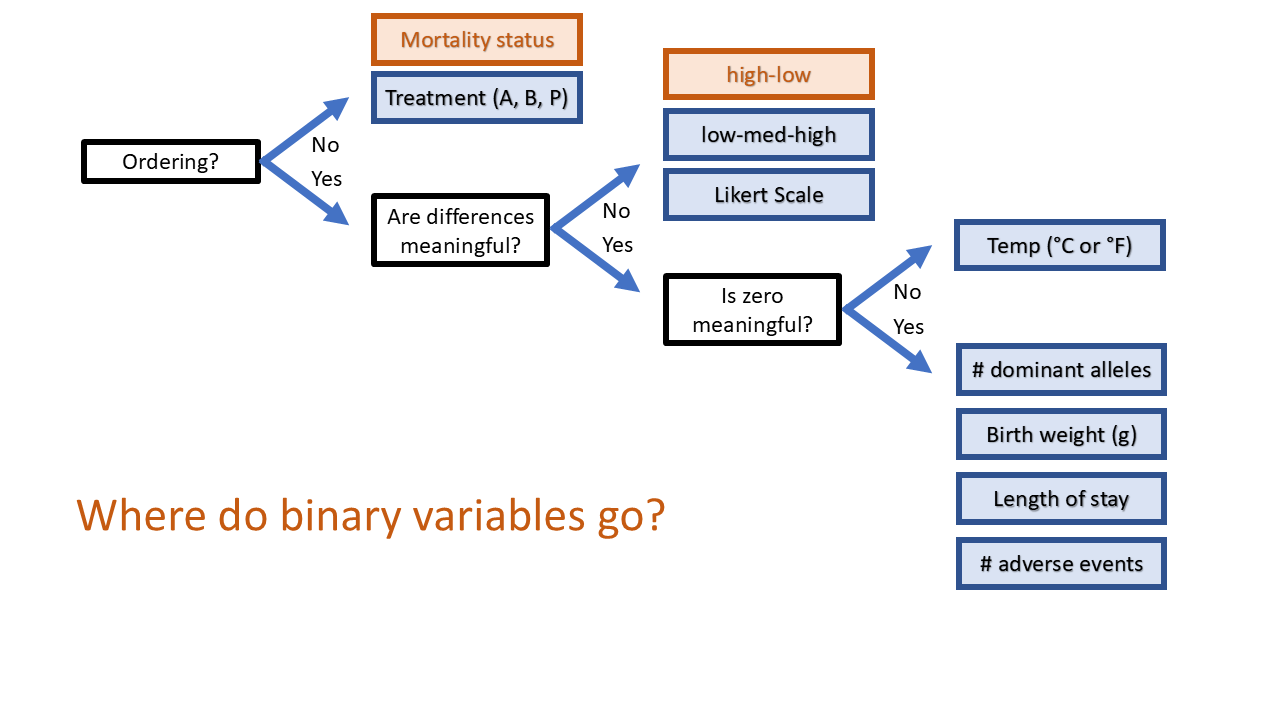
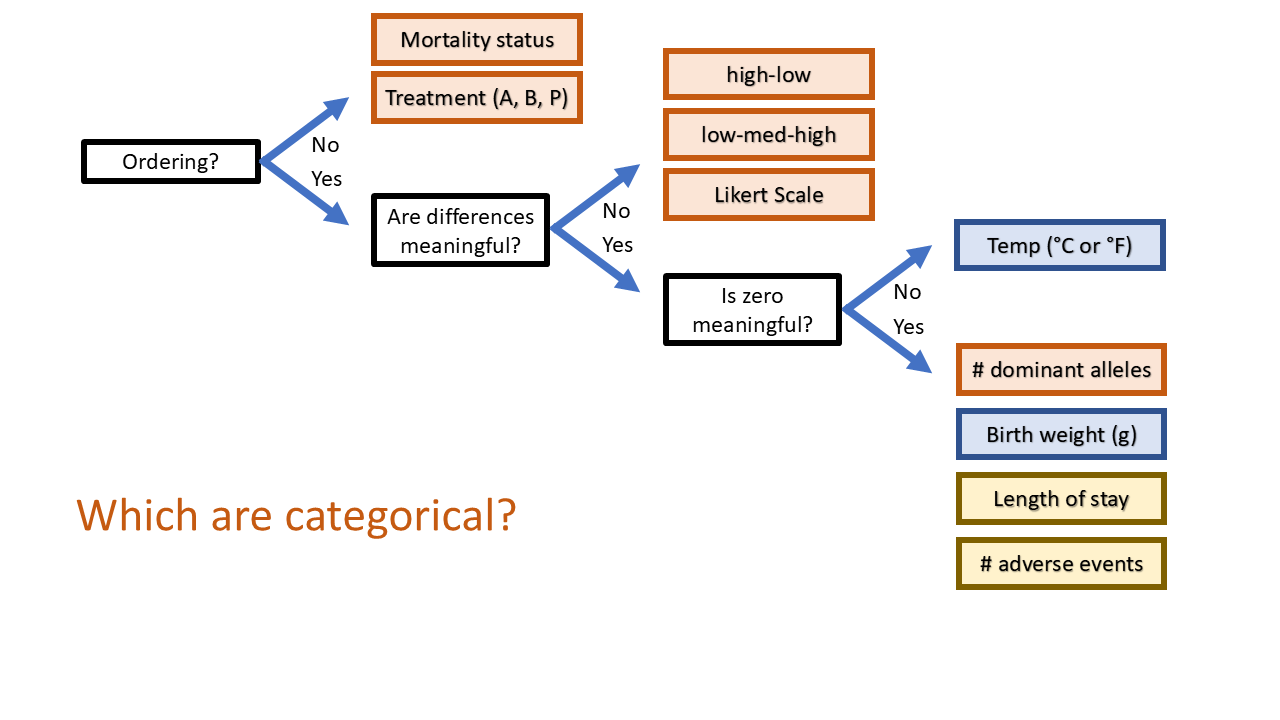
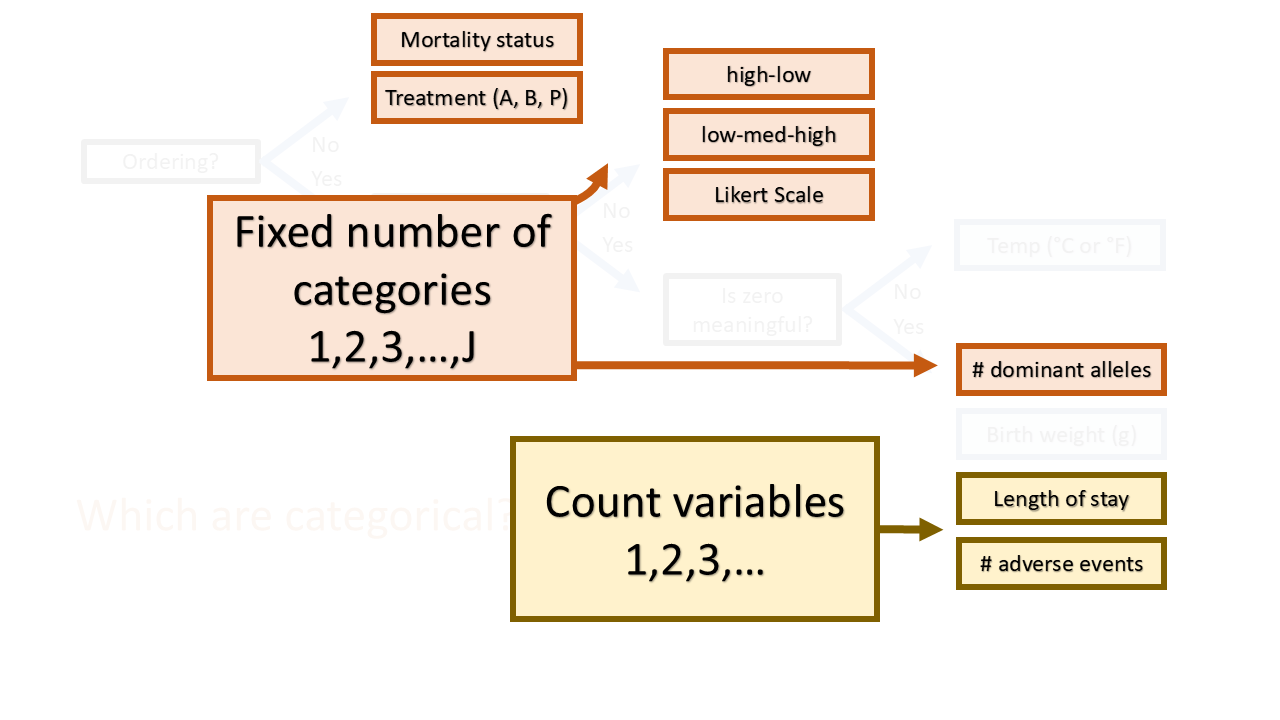
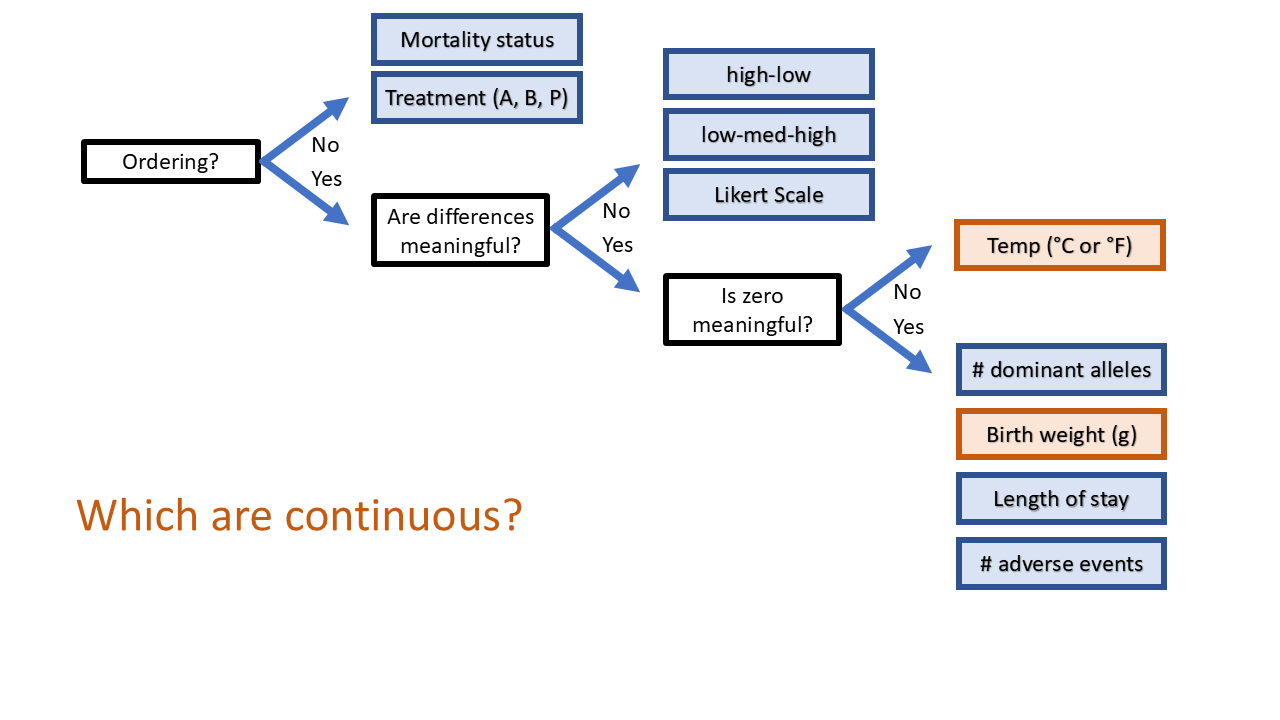
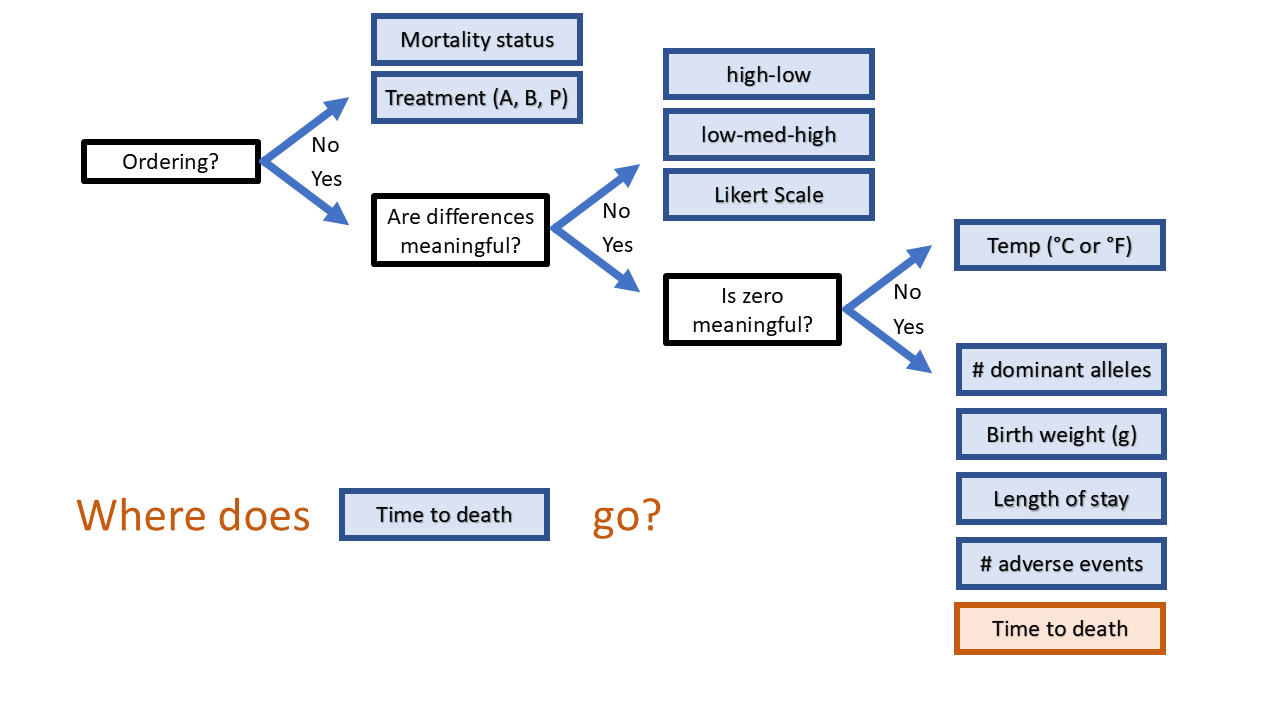
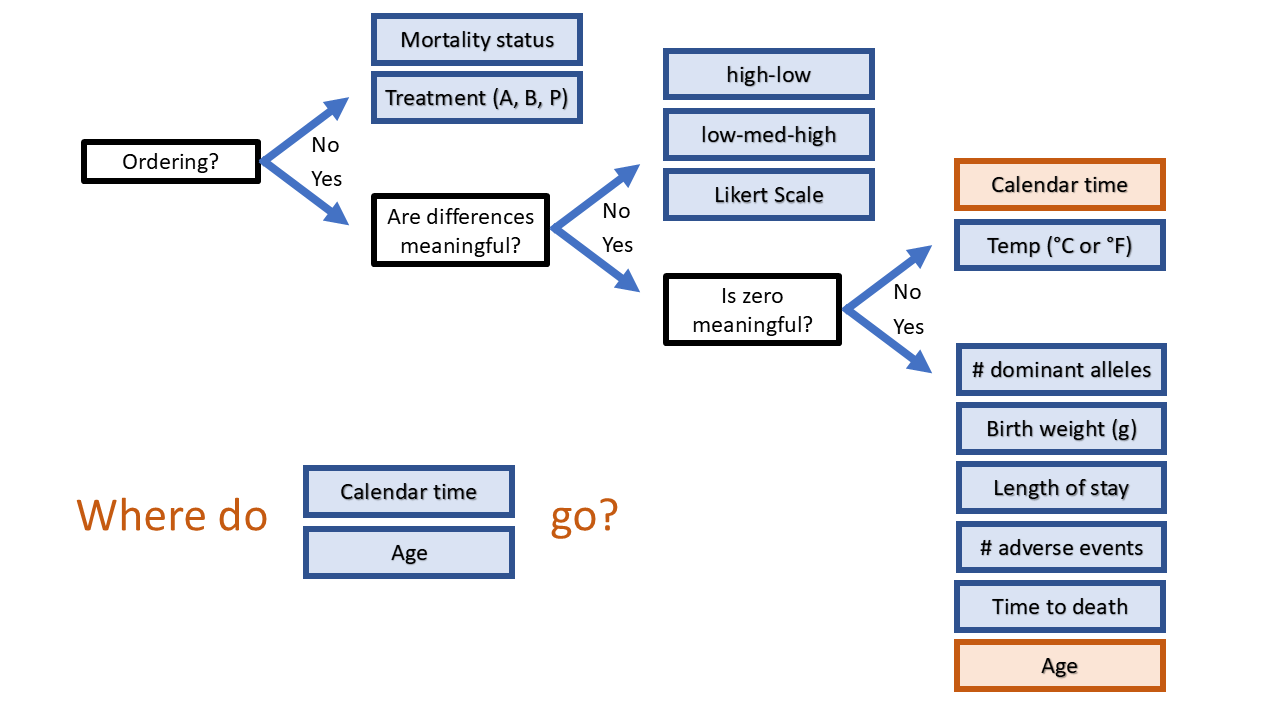
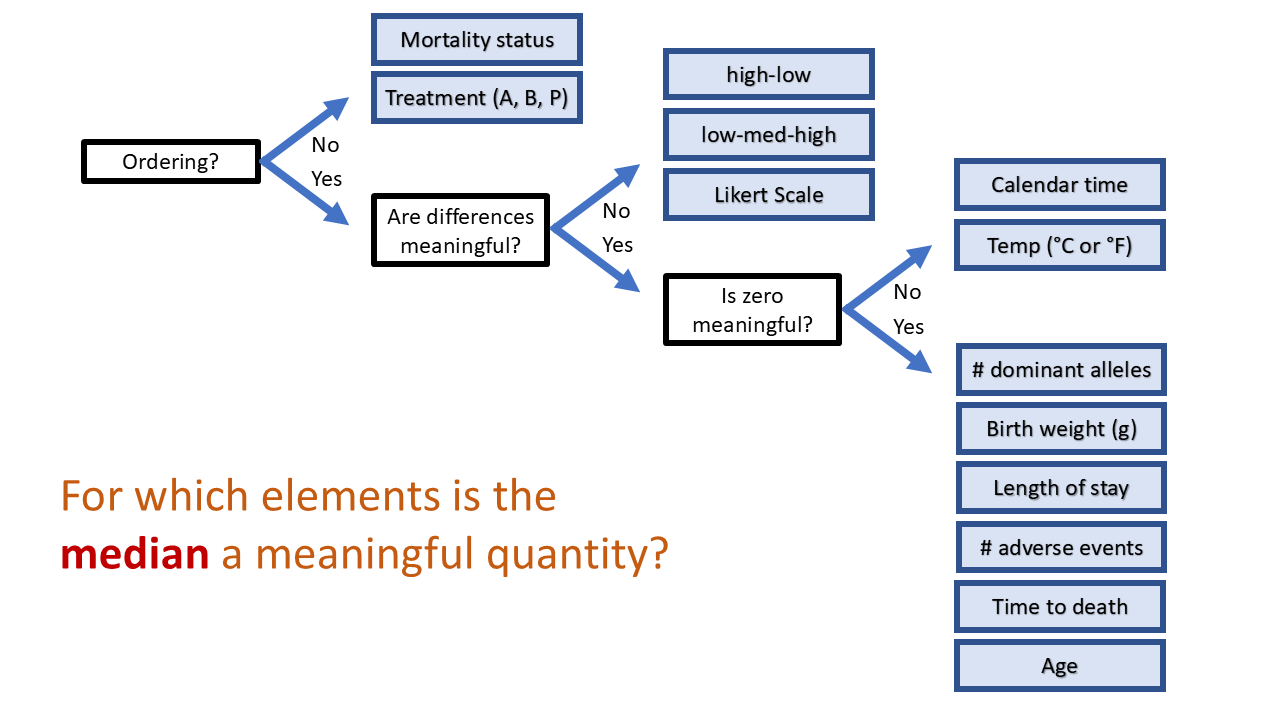
3.1 Hierarchy for univariate data