8 Sensitivity & Specificity

In this chapter, we will consider the special case of diagnostics, which is a special case of \(r\times c\) tables. Much of the terminology grew out of medical diagnostics with an emphasis on testing or screening for disease. In Data Science lingo, a diagnostic test or screen is a prediction based on inputs. Examples include pregnancy tests, COVID-19 nasal swab tests, or cancer screenings. While the manufactures of these diagnostic devices are strive for high accuracy, there a generally false positives or false negatives. In the context of disease and a diagnostic test, there are two random outcomes: the test prediction and the true disease status.
\[ \text{Test prediction} = T = \begin{array}{ll}T+ & \text{Test predicts disease is present} \\ T- & \text{Test predicts disease is absence} \end{array} \]
\[ \text{Disease status} = D = \begin{array}{ll}D+ & \text{Disease is present} \\ D- & \text{Disease is absence} \end{array} \]

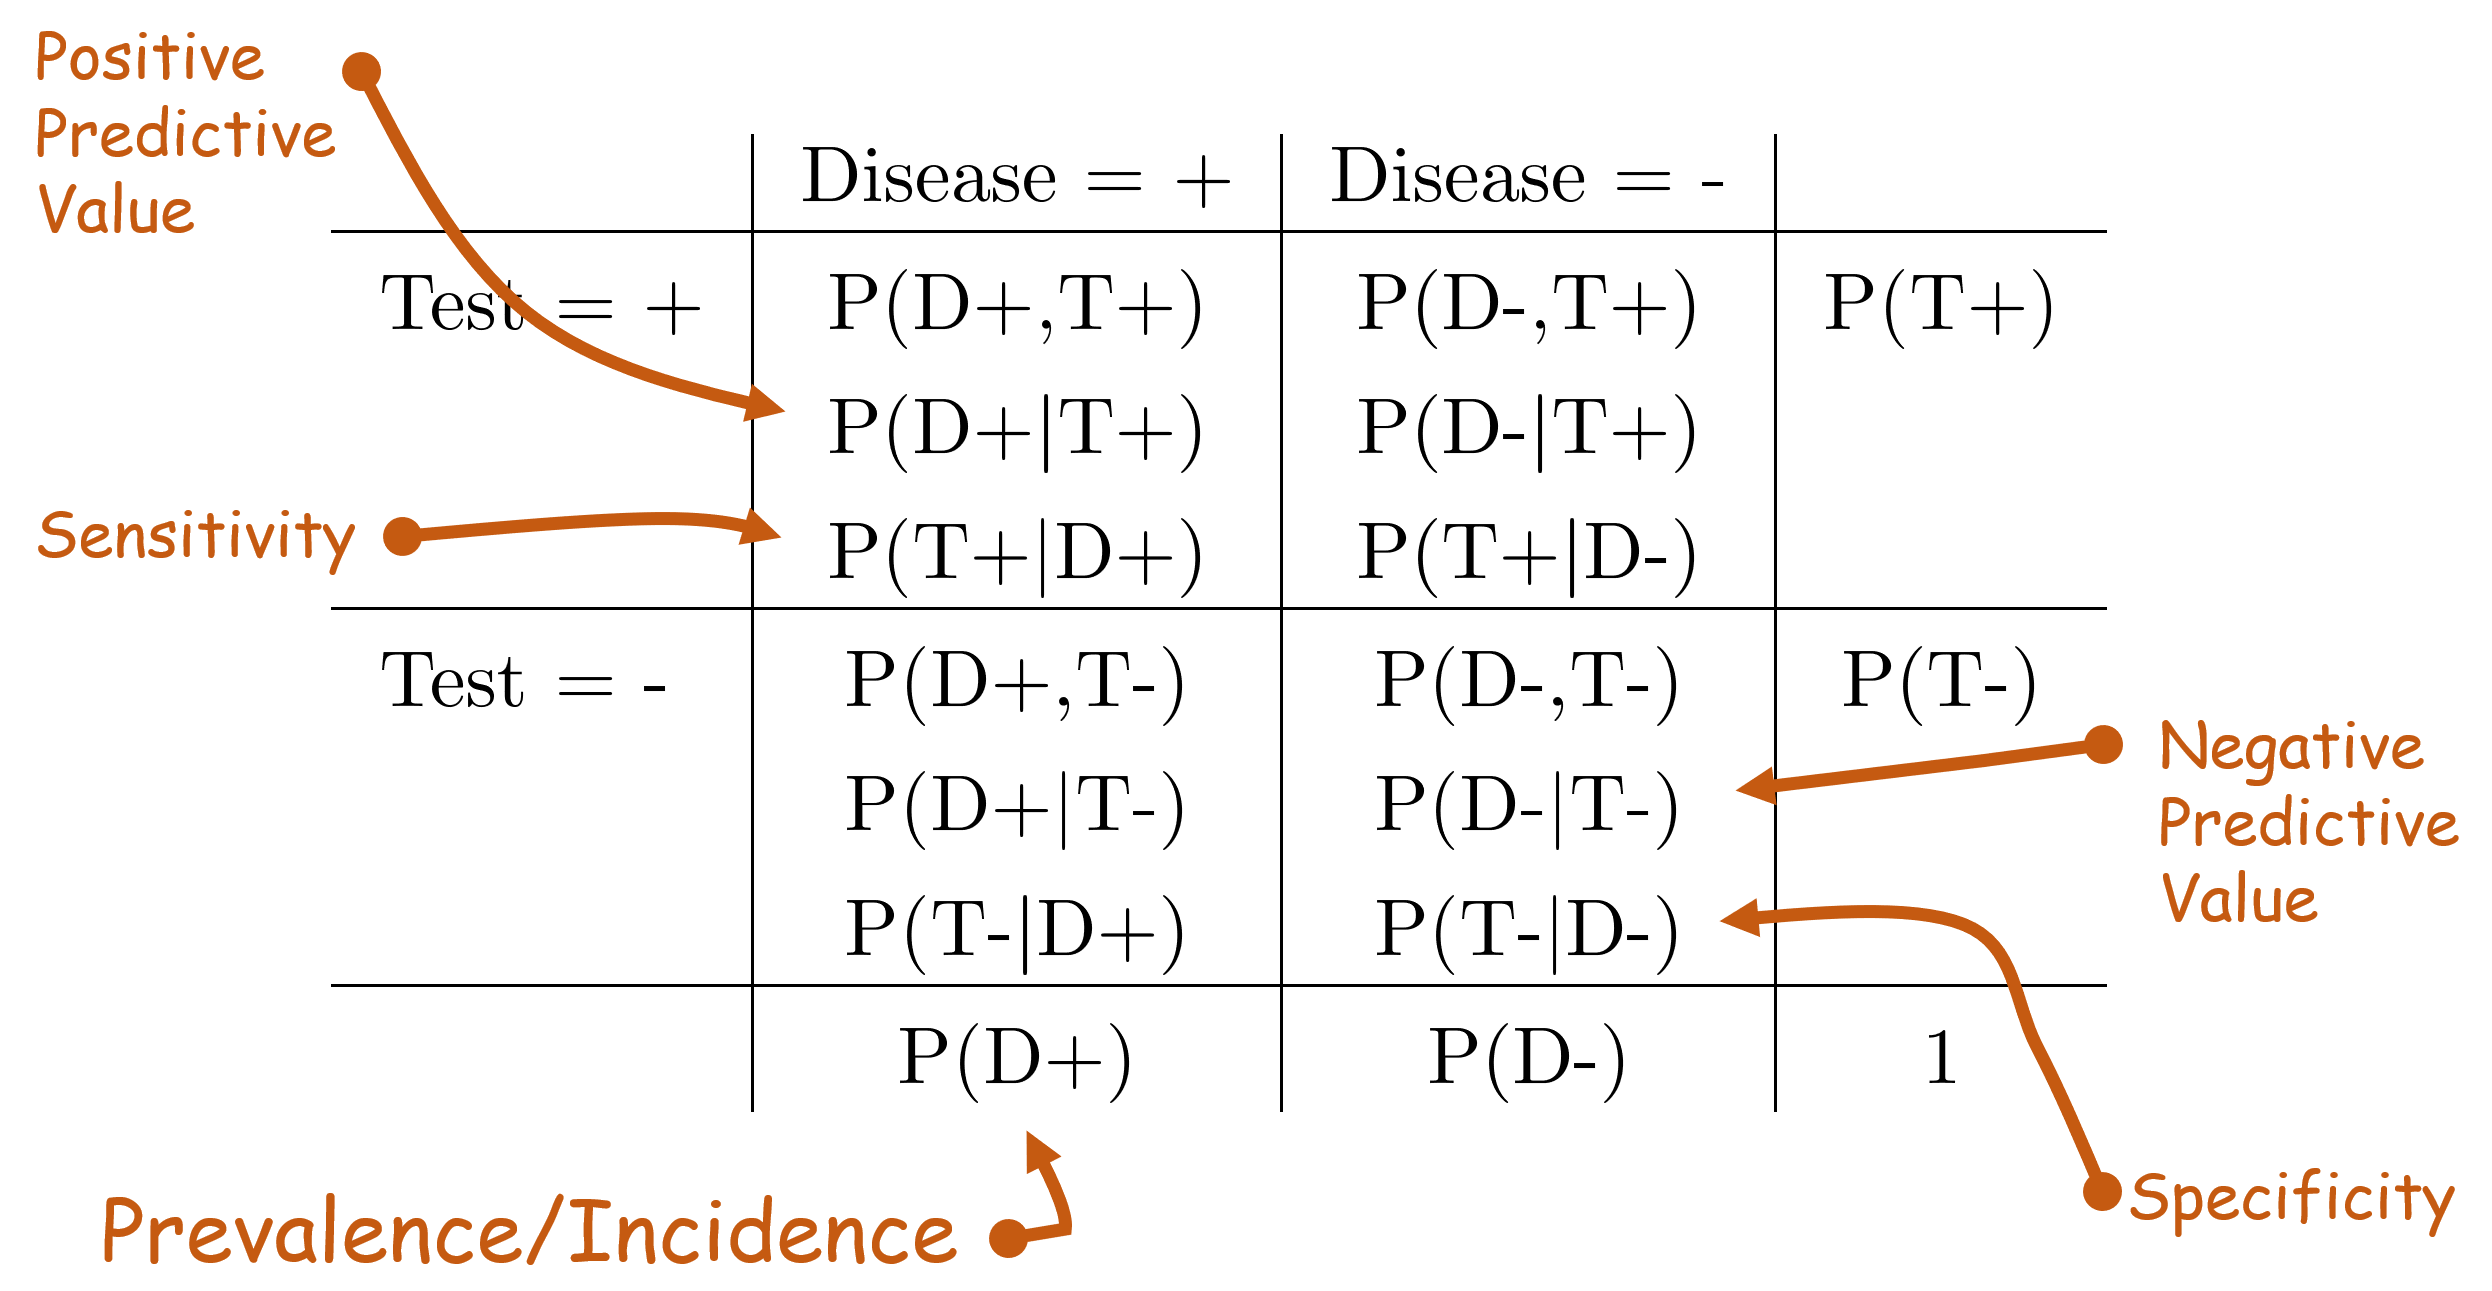
The two outcomes can be organized is a \(2\times 2\) table. All of the joint, conditional, and marginal probabilities are in the table as before; however, in the context of diagnostics, some of the probabilities have special names.
- Sensitivity
- Specificity
- Positive predictive value
- Negative predictive value
- Prevalence
- Incidence
8.1 Incidence vs prevalence
Incidence and prevalence are related terms but have a slightly different meaning. In a population of individuals, prevalence refers to the proportion who have the disease regardless of when it was diagnosed. In contrast, incidence refers to the proportion of individuals who are newly diagnosed with the disease. For example, from the National Cancer Institute (accessed 2025-10-28) it says:
The rate of new cases of cancer (cancer incidence) is 445.8 per 100,000 men and women per year (based on 2018–2022 cases).
Contrast that to how the CDC (accessed 2025-10-28) reports tobacco use:
In 2022, 49.2 million (19.8%)—or nearly 1 in 5—U.S. adults reported current tobacco product use.
Note that the NCI is reporting incidence while the CDC is reporting prevalence.
8.2 Manufacturer vs User
When the manufacturer needs to demonstrate the effectiveness of the test, they will assemble a cohort of individuals with the disease in question and a cohort of individuals without the disease. The test is administered and the predictions are compared to the truth. The quantities that are reported are the sensitivity and specificity.

Note however, that sensitivity and specificity are not the relevant quantities for the user of the test. After taking the test, the user wants to know the probability that the test is accurate. That is, the user of the test cares about the positive and negative predictive value.

8.3 Calculating the NPV and PPV from the Sensitivity and Specificity
Even if sensitivity and specifity is the only quantity reported by the manufacturer, the negative and positive predictive values can be calculated if the prevalence is known. One needs to apply the rules of probability.
| D+ | D- | ||
|---|---|---|---|
| T+ | j: r: c: Sensitivity |
||
| T- | j: r: c: |
Specificity |
|
| \(P(D+)\) |
8.4 Exercises
Exercise: Complete the table and calculate the positive and negative predictive value.
Exercise: Plot the positive predictive value as a function of prevalence. Let sensitivity = 0.95 and specificity = 0.9.
Exercise: A new rapid test for Lyme disease has a sensitivity of 92% and a specificity of 95%. In a population where the prevalence of Lyme disease is 8%, what are the positive predictive value (PPV) and negative predictive value (NPV) of this test?
Exercise: A screening test for colorectal cancer has a sensitivity of 85% and a specificity of 90%. If the test is used in a high-risk population where 15% of individuals have colorectal cancer, calculate the PPV and NPV.
Exercise: In a diabetes screening program, a blood glucose test has a PPV of 75% and an NPV of 98%. If the prevalence of diabetes in the tested population is 12%, determine the sensitivity and specificity of the test.
Exercise: A COVID-19 antigen test has a sensitivity of 88% and an NPV of 99.2% in a community where 3% of people are currently infected. Calculate the specificity of the test and then determine its PPV.
Exercise: A mammography screening program reports a PPV of 10% and an NPV of 99.5%. The prevalence of breast cancer in the screened population is 1%. What are the sensitivity and specificity of mammography in this population? (Note: A previous version used a prevalence of 0.5%, which was an error.)