big_well <- function(N) 100*rbinom(N, 1, 0.1)
sma_well <- function(N) 10*rbinom(N, 10, 0.1)HW 4
Question 1
Consider two investment opportunities. The first is a large water well project with a potential payoff of $100. The second opportunity is an investment series of 10 small wells, each with a potential payoff of $10. The probability that any well (large or small) returns a payoff is 0.1.
The functions below simulate the outcomes from the two investments.
Write code that generates the long-run proportions for the small well investment opportunity.
Solution
set.seed(23586293)
d1 <- sma_well(100000)
table(d1) |> proportions()
d1
0 10 20 30 40 50 60
0.34697 0.38654 0.19672 0.05680 0.01127 0.00158 0.00012 Question 2
Create a figure which visualizes the long-run proportions.
Solution
t1 <- table(d1) |> proportions()
barplot(t1, ylim = c(0,max(t1)*1.1), xlab = "Investment outcome", ylab = "Propability")
box()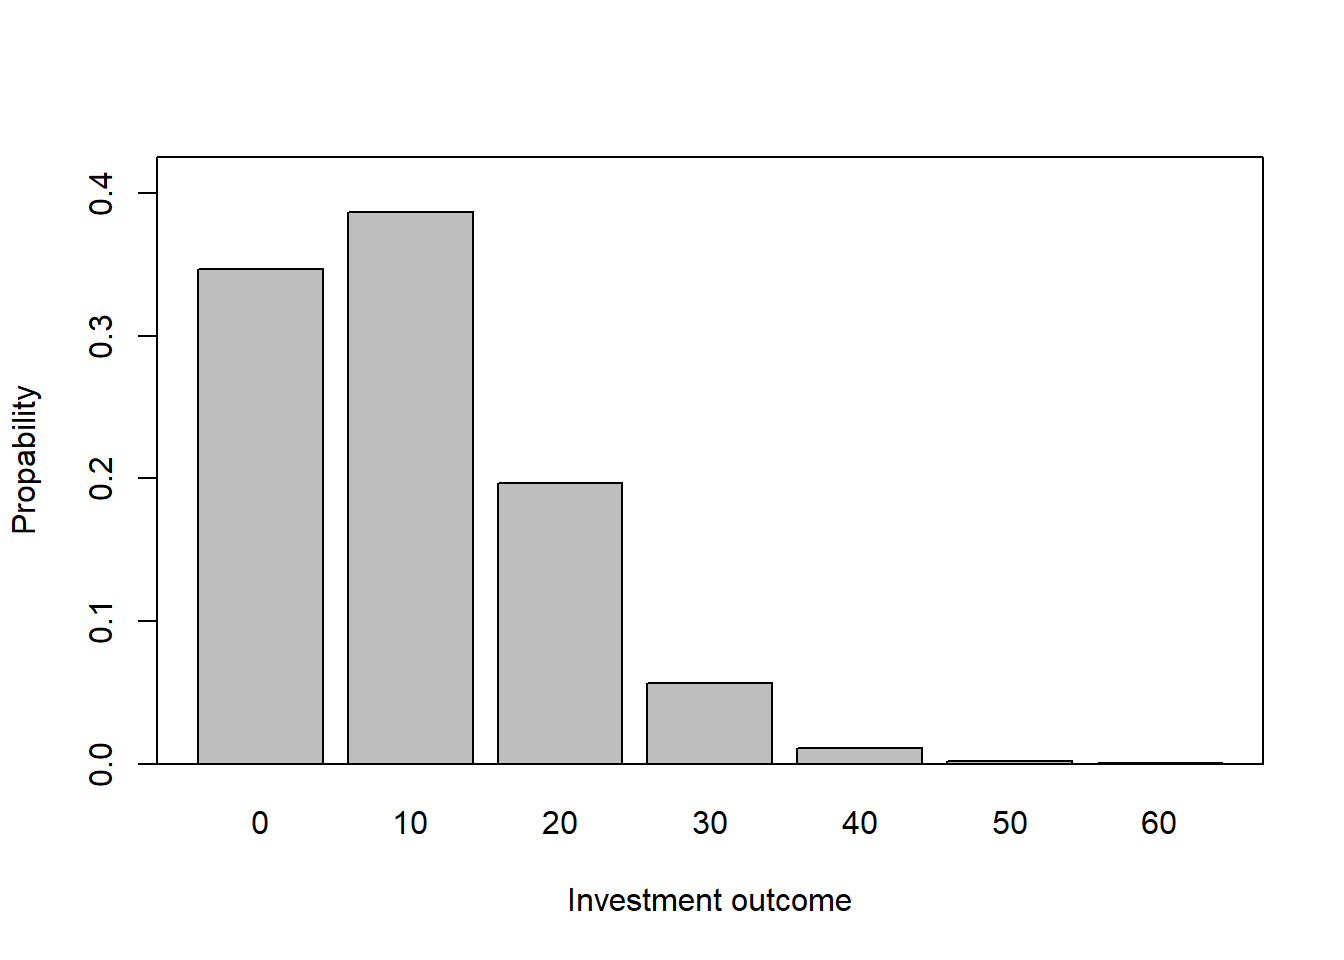
Question 3
Please read chapter 3 of Understanding Uncertainty. In section 3.9, the author introduces the notation p(E|K). What does K represent? Create an example where the probability of an event is different when K is different.
Question 4
If E denotes an event, what does Ec denote?
Question 5
Consider a potentially unfair six-sided die. Let E denote the outcome of a die roll. If P(E is even ) = .6, what must P(E is odd ) be? Why?
Question 6
Using simulation, create a script that will solve the Birthday Problem: In a class of 35 individuals, what is the probability that at least two individuals will share a birthday? (The code we developed in class is below).
- What does
set.seeddo in the script?
- What does
Rrepresent?
- Does the solution make any assumptions or simplifications? If so, what are they?
- Run both versions of the script. For version 1, use a class size of 35. Do both versions give the same answer?
- Add vertical and horizontal lines to the plot generated in version 2 which show your estimated probability generated with version 1 code.
- Look at the
first_duplicatefunction. What does the function return? Use?whichand?minto read the documentation of what these commands do. (Answer: It returns the first instance of _____.)
Version 1 of code
generate_class <- function(class_size){
  sample(1:365, class_size, replace = TRUE)
}

check_birthday <- function(class){
  class |> duplicated() |> any()
}

set.seed(230583)
R <- 10000
replicates <- replicate(R, generate_class(35) |> check_birthday())
mean(replicates)
[1] 0.8106Version 2 of code
first_duplicate <- function(){
    sample(1:365, 366, replace=TRUE) |>
    duplicated() |>
    which() |>
    min()
}

fd1 <- replicate(R, first_duplicate())
plot(ecdf(fd1), main = "Probability of shared birthday", xlab = "Class size")

abline(h=mean(replicates), col = "red")
abline(v=35, col = "red")
points(35, mean(replicates), pch = 16, cex = 2, col = "red")